In this post, I want to continue with the review of the post-processing filters. Even though contrast adjustment is not exactly a filter, I decided to include it here because it is another major tool that most people use on a regular basis. There are many different techniques to adjust the contrast of an image, but on this post I want to focus on two of them, namely histogram equalization and a more advanced version called Contrast Limited Adaptive Histogram Equalization, or CLAHE.
But first, let’s start by making clear what contrast and histogram means.
Table of Contents
Images are a representation of a scene that is captured using light. On a gray scale image, each pixel has a numeric value between a minimum and a maximum depending on how bright that pixel is. Since images are digital representations of the real world, each brightness level will have a correspondent value, but this value will depend on how many bits are being used to represent the image.
The maximum value has a direct dependence on the number of bits and can be calculated by the simple formula MaxVal = 2^(nbits) – 1, where MaxVal is the maximum value and nbits is the number of bits. A common number of bits to represent an image is 8 and that is what we are going to take here. So, with 8 bits, the maximum value of a pixel is 255. The rest of the scale is linear, with 0 being black and 255 white.
The contrast of an image is a measure of the range of brightness present in that image; simply put, is the difference between the brightest and the darkest pixels within it. As a general rule, the larger the contrast, the better the image will look, even though there are, as usual, exceptions to this rule.
A histogram is an organized way of representing how bright or dark an image is. It is represented by a type of plot in which the x-axis represents the different brightness levels of an image (255 for an 8-bit image) and the y-axis is the number of pixels that have a specific brightness level. The following image shows the same photo of the Brooklyn bridge that we used to illustrate the sharpening filter and its corresponding histogram.
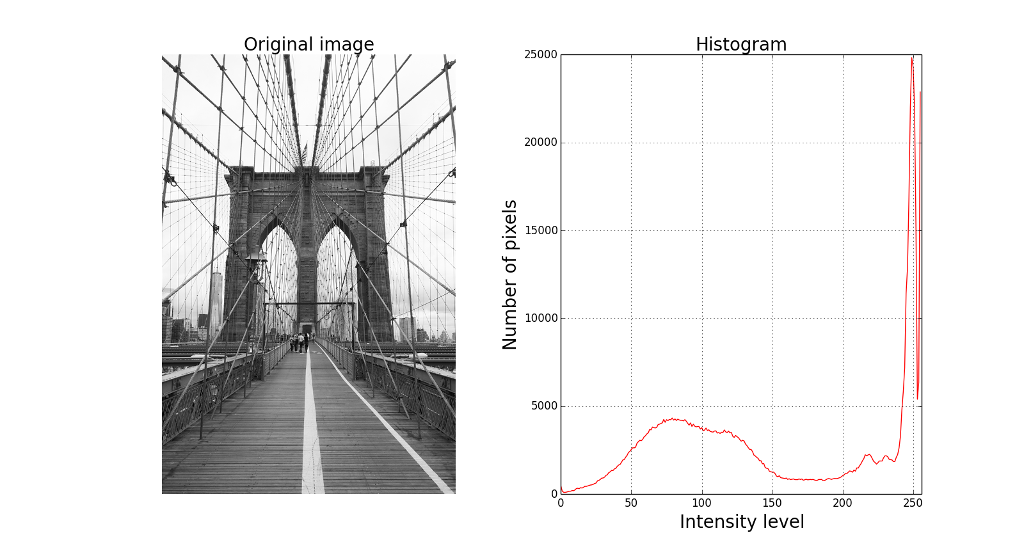
Already by looking at the histogram we can gather some important information on what exposure problems the image has and how it can be improved. The exposure problems do not always arise from an over- or underexposed image; sometimes it is just impossible to get information from all the regions of the scene due to the limited dynamic ranges of the available cameras. This is, in fact, the reason why high dynamic range (HDR) processing has become so popular.
As a general rule of thumb, the more distributed a histogram is along the intensity levels, the more appealing it will be for the human eye. This basically translated into a relatively flat histogram without pronounced peaks. This, of course, is a rule that can be constantly broken, especially with images that contain a lot of shadows or high contrast, but let’s keep that in mind for now.
In our image above, it can be seen that the histogram is not too flat, with one relatively small bump between 50 and 150 and a very pronounced peak at approximately 250. The brightness levels go from black (the darkest, with a value of 0) to white (the brightest, with a value of 255). The bump at around 100 represents the structure that has a mostly gray color, which is perfectly fine. The peak at 250 represents the sky, which is almost white due to an overcast day.
With the contrast enhancement techniques, what we want to achieve is a more evenly distributed histogram, which will help us recover some of the details on the areas the are right now too dark or too bright.
The first and most basic technique that we are going to look at here is the histogram equalization. The idea with this technique is simply to stretch the histogram in such a way that more intensity levels are covered. The technique does not distinguish between local intensities, making it a good choice for images that are either too dark or too bright in every region.
What the technique tries to achieve is to assign an equally probable intensity value to every pixel, with the final aim of obtaining a completely flat histogram. The following image shows the same scene as before, but after applying a histogram equalization method, together with the resulting histogram.
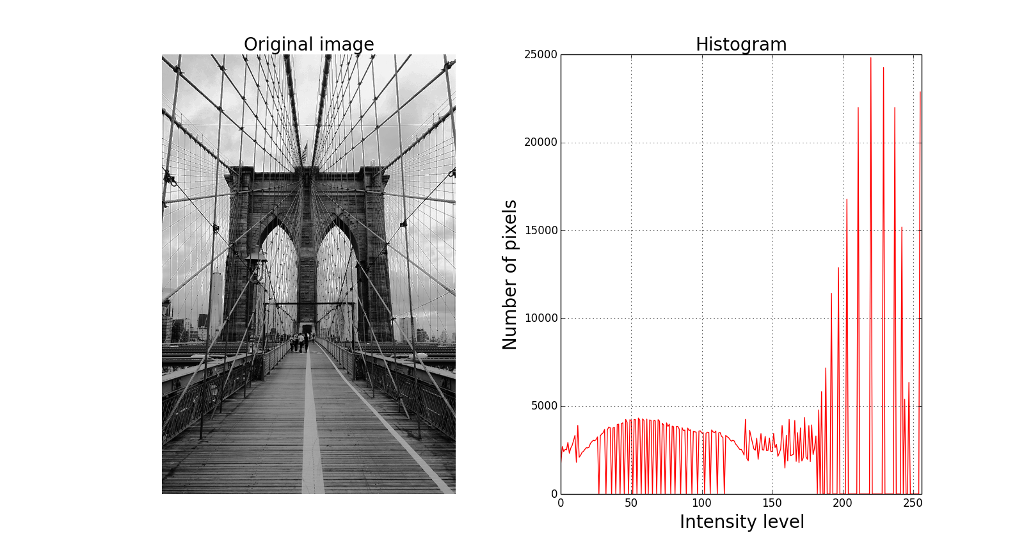
Since the procedure simply stretches the histogram, some intensity values are left out, which leads to a result that, even when good, it can definitely be improved by looking at the local contrast.
A solution for the above mentioned problem is the so-called CLAHE method. CLAHE is an adaptive method, meaning that, in contrast to the traditional histogram equalization, it calculated several histograms for different regions of the image before equalizing them. This way, it takes care of the original differences in brightness within an image, making it a great method to locally enhance contrast in an automated way.
Simply put, the method consists of applying several histogram equalization at different regions of the image, resulting in a much more balanced output image, additionally preventing the intensity gaps that result from the traditional histogram equalization.
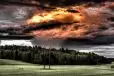
The following image shows the output of the CLAHE method when applied to our original scene, together with the corresponding histogram.

If we look at the histogram, we can see that a much flatter and well distributed curve results, something that, as stated at the beginning of this article, is expected to give a more appealing image.
To facilitate the comparison, the next two images show the three histograms side by side and the three corresponding images.

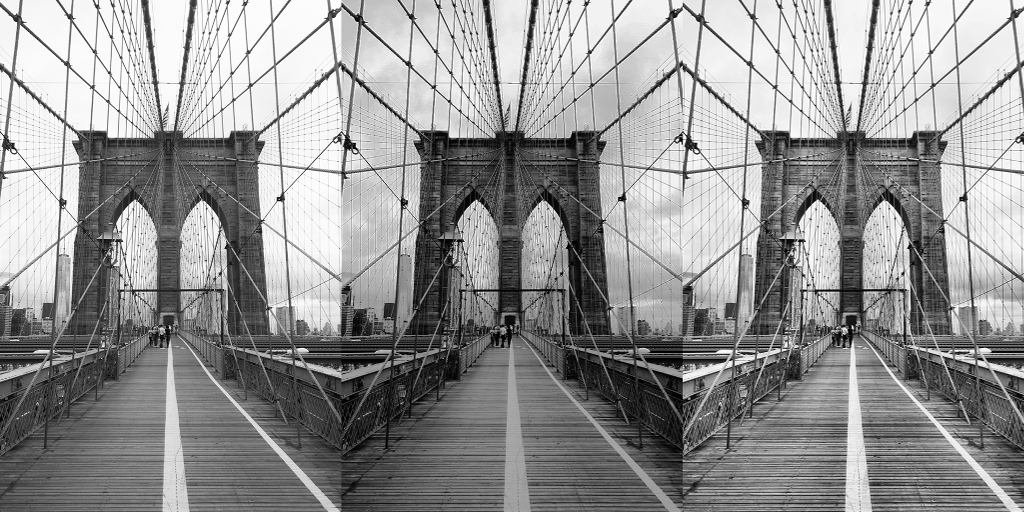
If we compare the three images, it is visible how the histogram equalization (middle) provided a significant improvement, especially when looking at the clouds that were practically invisible on the original image, but the overall result is simply too dark. This is a consequence of the histogram being pushed towards the darkest areas, something that the algorithm does to decrease the sharp peak that was present on the original histogram at the intensity values of 250.
By applying local enhancements, the CLAHE method (right) is able to recover the clouds by decreasing again the number of pixels with very high brightness values, but at the same time the contrast in the middle region that corresponds to the bridge structure is enhanced as well, giving a well balanced exposure in all regions.
I hope you enjoyed this post. Now you have a better idea on what happens with your image when you work with curve levels in Photoshop or when you simply enhance local contrast with some of the available tools and plugins in Photoshop or Lightroom.
If you have any question regarding the contents presented here, just write me an email and I will be happy to answer.


Please verify your software version before proceeding.
 I’ve verified my software version


 Facebook
 Google +
Comments (2)
hi, new at this photoshop, I’m using inpixieo now. learning now on your post thanks for the hard work. Do you have anything out there on the net with that program. Inpixieo Fitering, maximizer, blur, etc., type programs. thanks again. Chris
Very very very good teacher but I am asking where and how can I apply clahe in lightroom thanks inadvance